
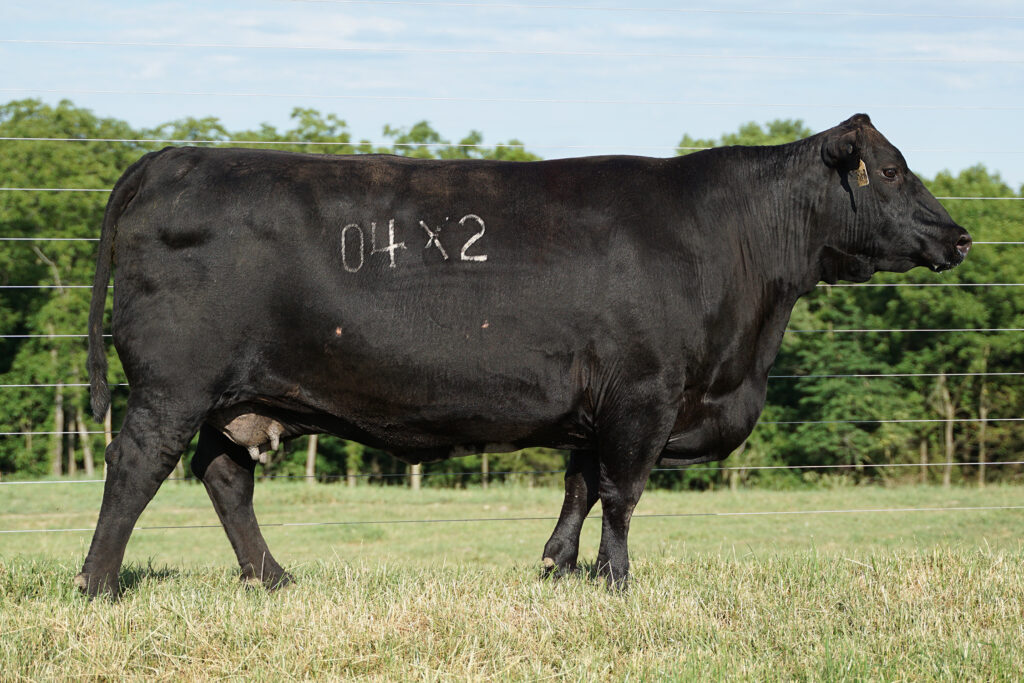
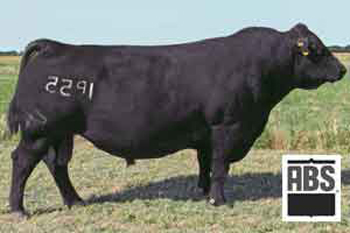
Summitcrest Elba 04X2
Birth date: 01/14/2010
Tattoo: 04X2
Sire Gardens Wave
Dam Summitcrest Elba 1M17
- She is maternal sister to 2 nationally known AI stud bulls: Summitcrest Complete 1P55 & Summitcrest Focus 2U66.
- She is direct daughter of Summitcrest Elba 1M17, the $43,000 top selling cow of Bases Loaded 2011, the dam of Complete 1P55 and Focus 2U66.
- Her legendary sire, Gardens Wave, was the only bull of the breed that ranks in the top 1% for $EN, Marb., REA, $W, $G, $QG, and the top 2% for $Beef. Wave was an excellent calving-ease bull that also reduced mature size, improving marbling EPDs and efficiency.
- Selected by J.J. Scheckel at the Summitcrest dispersion sale where she ratio over 100 for weaning and yearling measurements, against stiff competition.
- She is an outstanding cow, with breed leading carcass traits and efficiency. She always keeps her flesh like no other and is wide, deep and long in a moderate frame size.
Of over 300,000 active registered Angus dams in the breed, she ranks in the following EPD’s.
Top 25% Birth Weight EPD (BW) expressed in pounds, is a predictor of a sire’s ability to transmit birth weight to his progeny compared to that of other sires.
Top 25% Residual Average Daily Gain (RADG) expressed in pounds per day, is a predictor of a sire’s genetic ability for postweaning gain in future progeny compared to that of other sires, given a constant amount of feed consumed.
Top 10% Maternal Milk EPD (Milk) is a predictor of a sire’s genetic merit for milk and mothering ability as expressed in his daughters compared to daughters of other sires. In other words, it is that part of a calf’s weaning weight attributed to milk and mothering ability.
Top 15% Marbling EPD (Marb) expressed as a fraction of the difference in USDA marbling score of a sire’s progeny compared to progeny of other sires.
Top 2% Ribeye Area EPD (RE) expressed in square inches, is a predictor of the difference in ribeye area of a sire’s progeny compared to progeny of other sires.
Top 20% Weaning Weight EPD (WW) expressed in pounds, is a predictor of a sire’s ability to transmit weaning growth to his progeny compared to that of other sires.
Top 3% Grid Value ($G), an index value expressed in dollars per head, is the expected average difference in future progeny performance for carcass grid merit compared to progeny of other sires.
Top 10% Quality Grade ($QG), $QG represents the quality grade segment of the economic advantage found in $G. $QG is intended for the specialized user wanting to place more emphasis on improving quality grade. The carcass marbling (Marb) EPD contributes to $QG.
Top 3% Yield Grade ($YG), $YG represents the yield grade segment of the economic advantage found in $G. $YG is intended for the specialized user wanting to place more emphasis on red meat yield. It provides a multi-trait approach to encompass ribeye, fat thickness and weight into an economic value for red meat yield.
Top 20% Beef Value ($B), an index value expressed in dollars per head, is the expected average difference in future progeny performance for post-weaning and carcass value compared to progeny of other sires.
| BW | WW | YW | Milk | $W | $B |
| .2 | 33 | 60 | 27 | 39.38 | 108.09 |


